As many of you know, DECA banned gambling several weeks ago. However, what if I told you that DECA was forcing you to gamble 19 life pots every time you leveled-up a character? With that, I present
Perhaps that introduction was a little sensationalist. Allow me to explain my reasoning in detail.
Not all characters are created equal. Every time you level up, your character can gain anywhere between 20 and 30 hit-points. If you want an 8/8 character, max HP, you can do one of two things
-
Reroll (this entails killing bad characters) over and over again until you get a character that gained 30 HP points for all 19 level-ups. This automatically makes your character max life. Unfortunately, the odds of this is (1/11)^19. Read that as 1, divided by 11. Now multiple 1/11 by itself 19 times. How low is 1/(11^19)? Well, if you rolled a character to level 20 every second, and you rolled non-stop, it would still take you 2 million million years on average to do this.
-
Have some sense. You get a roll (probably not going to be maxed fresh) and cover the difference with lifepots. If I rolled +25 on every level up (which is standard), I am (30-25)*19 = 95 hitpoints short. Each lifepot gives 5 hp. Thus, I can drink 19 lifepots and max life that way.
You can guess that most people opt for 2). However, what if I only get +24 on each level? The difference is remarkable. Now I need (30-24)*19 = 114 hp points. That’s 23 lifepots–4 more than the average! If I got this bad a roll, I would need an extra unbounded hp ring just to get the same stats as an average roll!
So you can guess that rolling matters quite a bit. However, what makes a good roll? How realistic is that “I want a +30 roll!”?
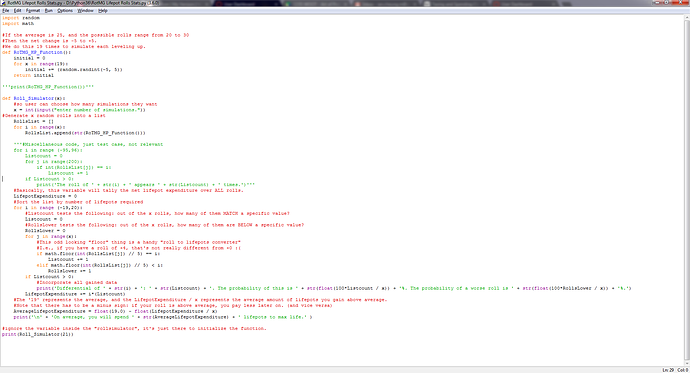
I rolled a character 100,000 times–on a computer program, of course! (Come on, how much time do you think I have?) I used Python 3.6 with the help of LordDscale; the code is down below. Note that you can input however many rolls you wish to simulate!
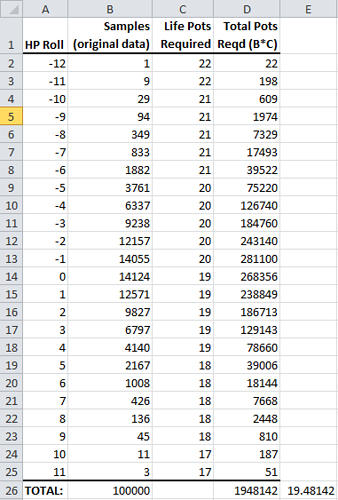
As for results, I got the following:
Differential of -12: 1. The probability of this is 0.001%. The probability of a worse roll is 0.0%.
Differential of -11: 9. The probability of this is 0.009%. The probability of a worse roll is 0.001%.
Differential of -10: 29. The probability of this is 0.029%. The probability of a worse roll is 0.01%.
Differential of -9: 94. The probability of this is 0.094%. The probability of a worse roll is 0.039%.
Differential of -8: 349. The probability of this is 0.349%. The probability of a worse roll is 0.133%.
Differential of -7: 833. The probability of this is 0.833%. The probability of a worse roll is 0.482%.
Differential of -6: 1882. The probability of this is 1.882%. The probability of a worse roll is 1.315%.
Differential of -5: 3761. The probability of this is 3.761%. The probability of a worse roll is 3.197%.
Differential of -4: 6337. The probability of this is 6.337%. The probability of a worse roll is 6.958%.
Differential of -3: 9238. The probability of this is 9.238%. The probability of a worse roll is 13.295%.
Differential of -2: 12157. The probability of this is 12.157%. The probability of a worse roll is 22.533%.
Differential of -1: 14055. The probability of this is 14.055%. The probability of a worse roll is 34.69%.
Differential of 0: 14124. The probability of this is 14.124%. The probability of a worse roll is 48.745%.
Differential of 1: 12571. The probability of this is 12.571%. The probability of a worse roll is 62.869%.
Differential of 2: 9827. The probability of this is 9.827%. The probability of a worse roll is 75.44%.
Differential of 3: 6797. The probability of this is 6.797%. The probability of a worse roll is 85.267%.
Differential of 4: 4140. The probability of this is 4.14%. The probability of a worse roll is 92.064%.
Differential of 5: 2167. The probability of this is 2.167%. The probability of a worse roll is 96.204%.
Differential of 6: 1008. The probability of this is 1.008%. The probability of a worse roll is 98.371%.
Differential of 7: 426. The probability of this is 0.426%. The probability of a worse roll is 99.379%.
Differential of 8: 136. The probability of this is 0.136%. The probability of a worse roll is 99.805%.
Differential of 9: 45. The probability of this is 0.045%. The probability of a worse roll is 99.941%.
Differential of 10: 11. The probability of this is 0.011%. The probability of a worse roll is 99.986%.
Differential of 11: 3. The probability of this is 0.003%. The probability of a worse roll is 99.997%.
On average, you will spend 19.40721 lifepots to max life.
You might be wondering why it costs more than 19 lifepots on average, if 19 lifepots should be standard. It has to do with the fact that lifepots can give less than 5 hp, but never more. Say you have 2 hitpoints to max. You only gain 2 more from the lifepot!
Because of the reasons mentioned before, results are skewed left–that is, results tend to be worse more often than better. Interestingly, there is a 48.75% chance–almost half–that you won’t even roll average. And the chance of rolling above average is 37%.
Let’s say you want to save 4 lifepots or more on a roll. The chances of this are 100% - 92% = 8%. Think of it this way: I pick two whole numbers between 1 and 25 inclusive. Now guess one of my numbers.
You might notice that numbers near the middle are more frequent than the outer values. This has to do with something known as the bell curve; put another way, the average is most common on average.
It really depends on how much time you have. Personally, I wouldn’t settle for a differential of less than 2 unless other stats are very good–chances are, I’ll get a better roll after 3 or 4 tries! I know people who have killed +17 hp rolls because it was “only” +3 lifepots.
Happy rolling! Let me know if you have any comments or suggestions.
–Perseus
P.S. So, unfortunately, I can’t attach a program to the post. Yay. I can, however, attach a picture
of my code. For the more diligent (or desperate) among you adventurers, you can copy the code and try it yourself. Note that anything red is unnecessary; it only contains my notes. Good luck!

